Facile
Dans la blockchain, la transparence est une promesse, mais en pratique, suivre les flux de tokens et comprendre la répartition des fonds peut vite devenir complexe. Qui détient réellement un actif ? Comment les fonds circulent-ils ? Quels signaux peuvent indiquer une manipulation de marché ?
Bubblemaps est un outil qui visualise les transactions et connexions entre portefeuilles sous forme de bulles interactives. Son objectif principal est de simplifier l’analyse on-chain en rendant visibles les clusters de wallets interconnectés, les accumulations par les whales, et les anomalies dans la distribution des tokens.
Grâce à Bubblemaps, il devient possible de :
✔️ Repérer rapidement les principaux détenteurs d’un projet.
✔️ Identifier les connexions entre wallets et leurs interactions.
✔️ Détecter d’éventuels schémas de manipulation, comme le wash trading.
✔️ Analyser l’évolution d’un projet en visualisant l’historique des transactions.
Dans ce guide, nous allons d’abord expliquer comment fonctionne Bubblemaps en général, avant d’analyser un cas concret : le token Jupiter (JUP) sur Solana, en croisant les données avec Arkham, Tokenomist et CoinMarketCap pour une étude approfondie.
Table des matières
Comment Accéder à Bubblemaps et Sélectionner une Blockchain
L’outil est partiellement accessible gratuitement, mais certaines fonctionnalités avancées nécessitent une connexion via un wallet Web3 (MetaMask, Exodus etc.) ou un compte X (Twitter).
📌 Accès Premium : Pour débloquer toutes les fonctionnalités de Bubblemaps, il faut détenir 250 milliards de tokens Moonlight, ce qui permet notamment :
✔️ D’explorer en profondeur tous les tokens DeFi et collections NFT.
✔️ D’accéder à l’historique complet des cartes (Time Travel) et d’actualiser les données.
La version gratuite permet tout de même d’avoir accès à un panel d’informations conséquent.
Une fois connecté, on peut choisir la blockchain à analyser parmi celles prises en charge :
- Ethereum
- BNB Chain
- Solana
- Avalanche
- Polygon, etc.
📸 Exemple : nous allons utiliser plusieurs exemples, Reserve Rights sur Ethereum, la collection de NFT Squiggles sur Ethereum et enfin Jupiter sur Solana.
Explorer un Token avec Bubblemaps : Connexions et Clusters
Une fois la blockchain sélectionnée, il est possible de rechercher un projet spécifique en entrant son nom ou son adresse de contrat.
Bubblemaps génère alors une carte interactive qui affiche :
🔹 Des bulles représentant chaque wallet – Plus elles sont grandes, plus elles détiennent de tokens.
🔹 Des connexions entre les bulles – Elles illustrent les transactions entre portefeuilles.
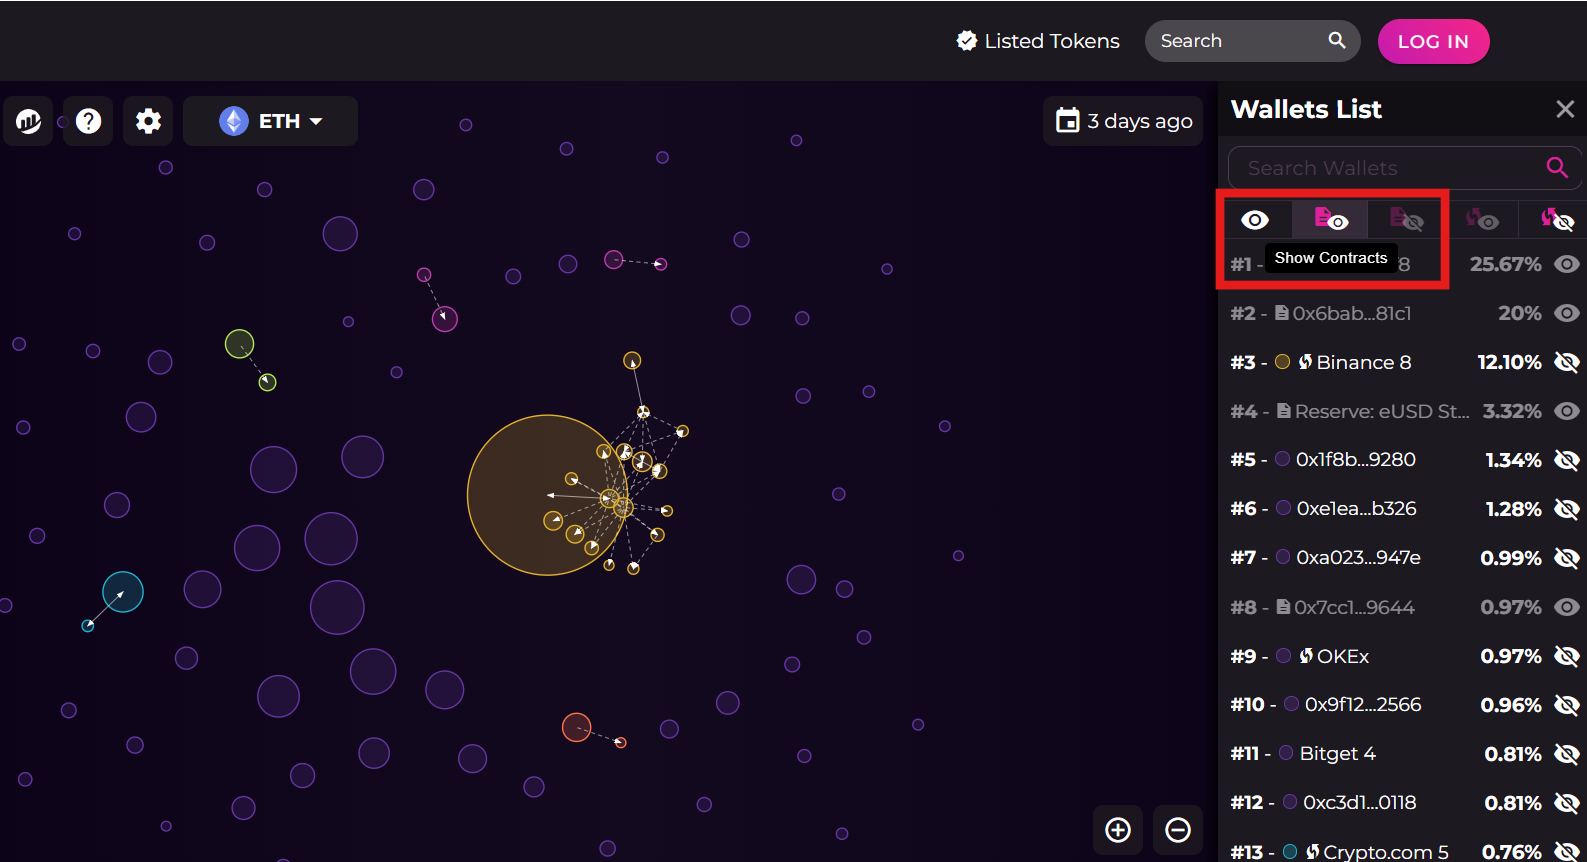
🔹 Des couleurs indiquant les clusters de wallets liés – Cela permet d’identifier les groupes de portefeuilles qui interagissent fréquemment entre eux (exemple ci-dessous avec un cluster de Binance du token RSR sur la blockchain Ethereum)
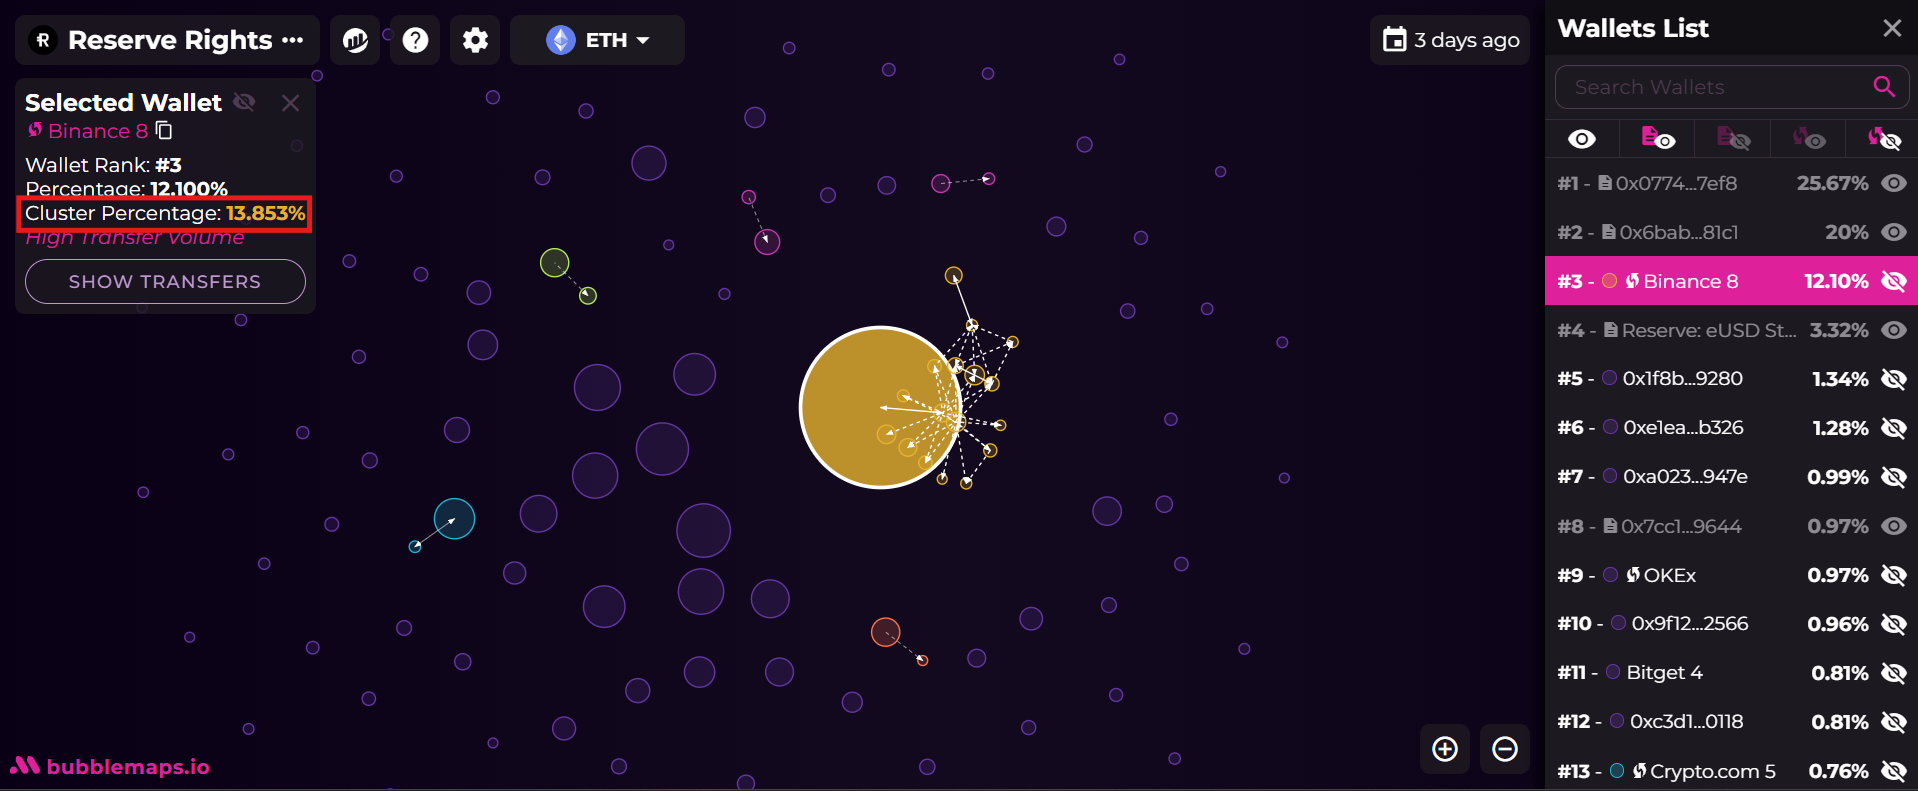
Plus di’nformations sur les récompenses ici
📌 Les connexions entre portefeuilles peuvent signifier plusieurs choses :
✔️ Un simple déplacement de fonds entre wallets appartenant au même utilisateur.
✔️ Un transfert vers ou depuis une plateforme d’échange (CEX ou DEX).
✔️ Un schéma de wash trading (voir section suivante).
✔️ Une distribution planifiée (allocation d’équipe, vesting, staking, etc.).
Bubblemaps propose deux options essentielles pour affiner l’analyse :
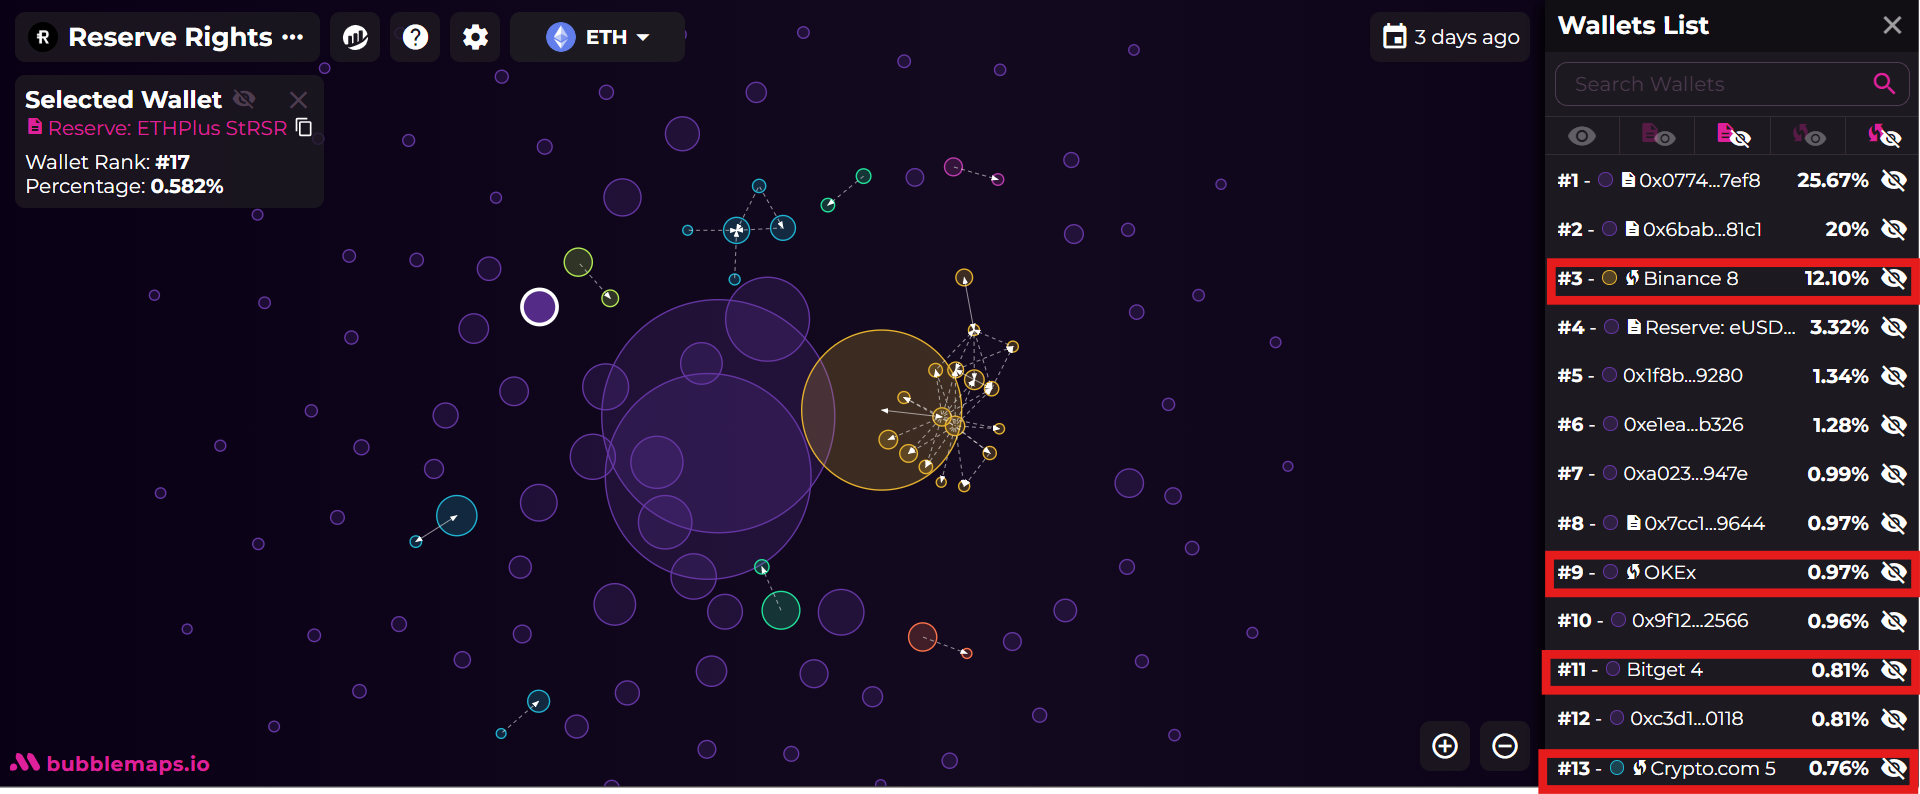
🔍 Show/Hide Contracts : Permet d’afficher ou masquer les smart contracts liés au projet. Cela peut inclure des contrats de vesting, de staking, ou des pools de liquidité sur les DEX.
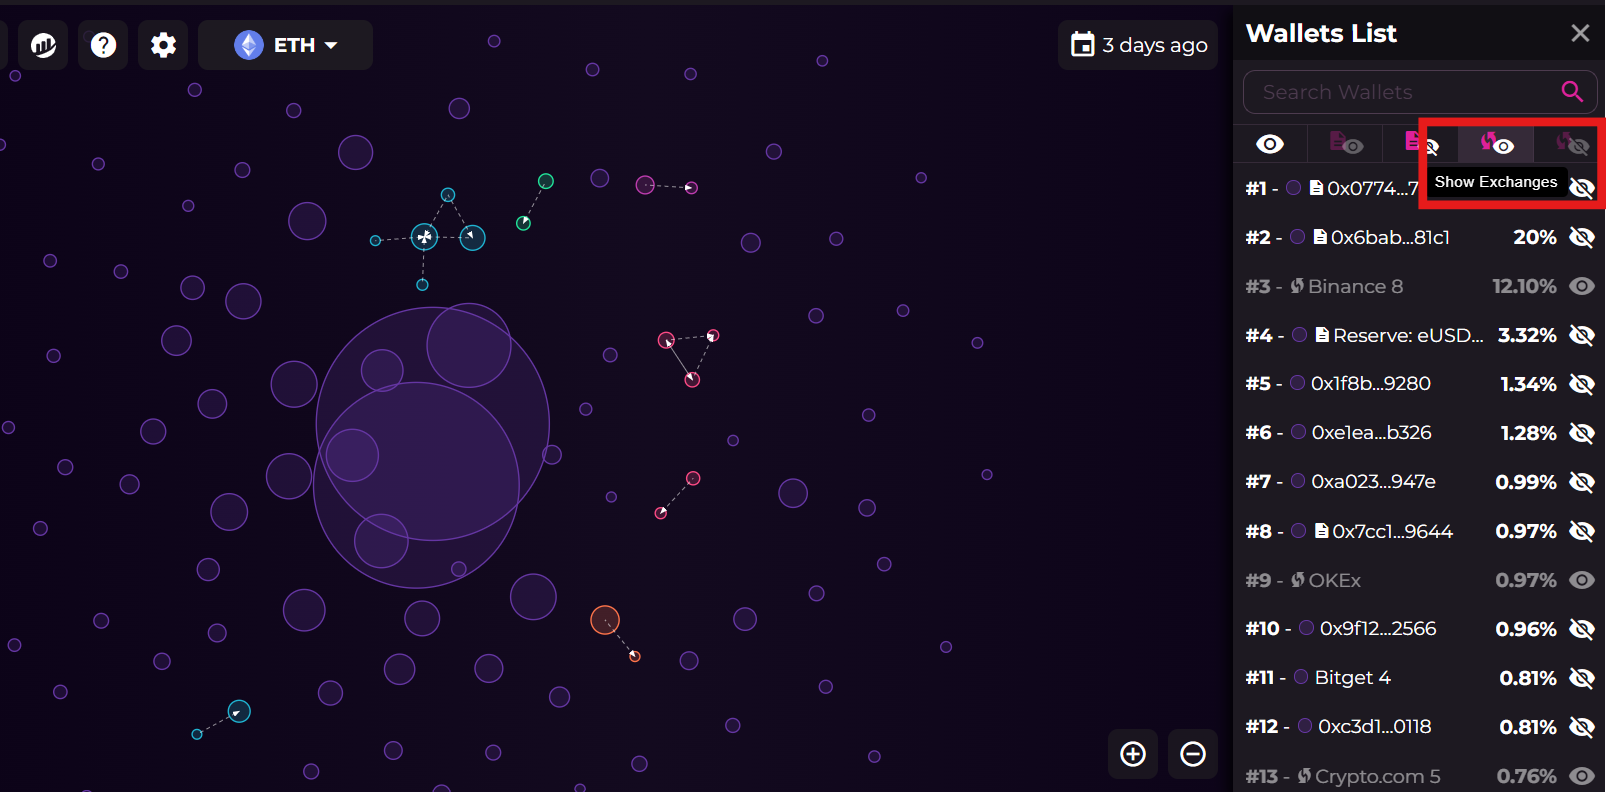
💱 Show/Hide Exchanges : Masque ou affiche les wallets appartenant aux plateformes d’échange centralisées (CEX). Ces wallets sont souvent utilisés pour stocker la liquidité des tokens disponibles sur les marchés. Cette option permet d’identifier si une grosse part de l’offre est détenue sur un CEX, ce qui peut influencer la liquidité et la volatilité du token.
Le Wash Trading : Pourquoi Gonfler le Volume est Avantageux ?
Le wash trading est une pratique de manipulation de marché où des acteurs s’échangent un actif entre eux pour simuler une activité de trading importante.
📌 Pourquoi faire du wash trading ?
✔️ Créer un faux sentiment de liquidité : En augmentant artificiellement le volume d’échange, cela donne l’illusion que le token est très actif.
✔️ Attirer plus d’investisseurs : Les traders et algorithmes détectent souvent les actifs à fort volume. Un token avec une activité élevée est plus susceptible d’attirer de nouveaux acheteurs.
✔️ Améliorer le classement sur les plateformes : Les exchanges et agrégateurs comme CoinMarketCap classent souvent les tokens en fonction de leur volume d’échange. Un wash trading efficace permet d’être mieux classé et plus visible.
✔️ Faciliter l’acceptation sur les exchanges : Un projet avec un volume artificiellement élevé peut paraître plus attractif aux exchanges centralisés, qui cherchent à lister des tokens populaires.
📸 Détection sur Bubblemaps :
Un wash trading peut être repéré en observant des connexions répétitives entre un petit groupe de wallets, où les tokens reviennent systématiquement aux mêmes adresses sans transactions externes significatives.
Identifier et Comprendre les Clusters
Un cluster est un ensemble de wallets qui échangent fréquemment des tokens entre eux. L’analyse des clusters permet de :
✔️ Déterminer la centralisation d’un token.
✔️ Repérer des activités suspectes, comme des ventes coordonnées.
✔️ Identifier la gestion des fonds par une équipe ou une DAO.
📌 Pourquoi c’est important ?
Un cluster très dense contrôlé par une même entité peut signifier que le projet est fortement centralisé.
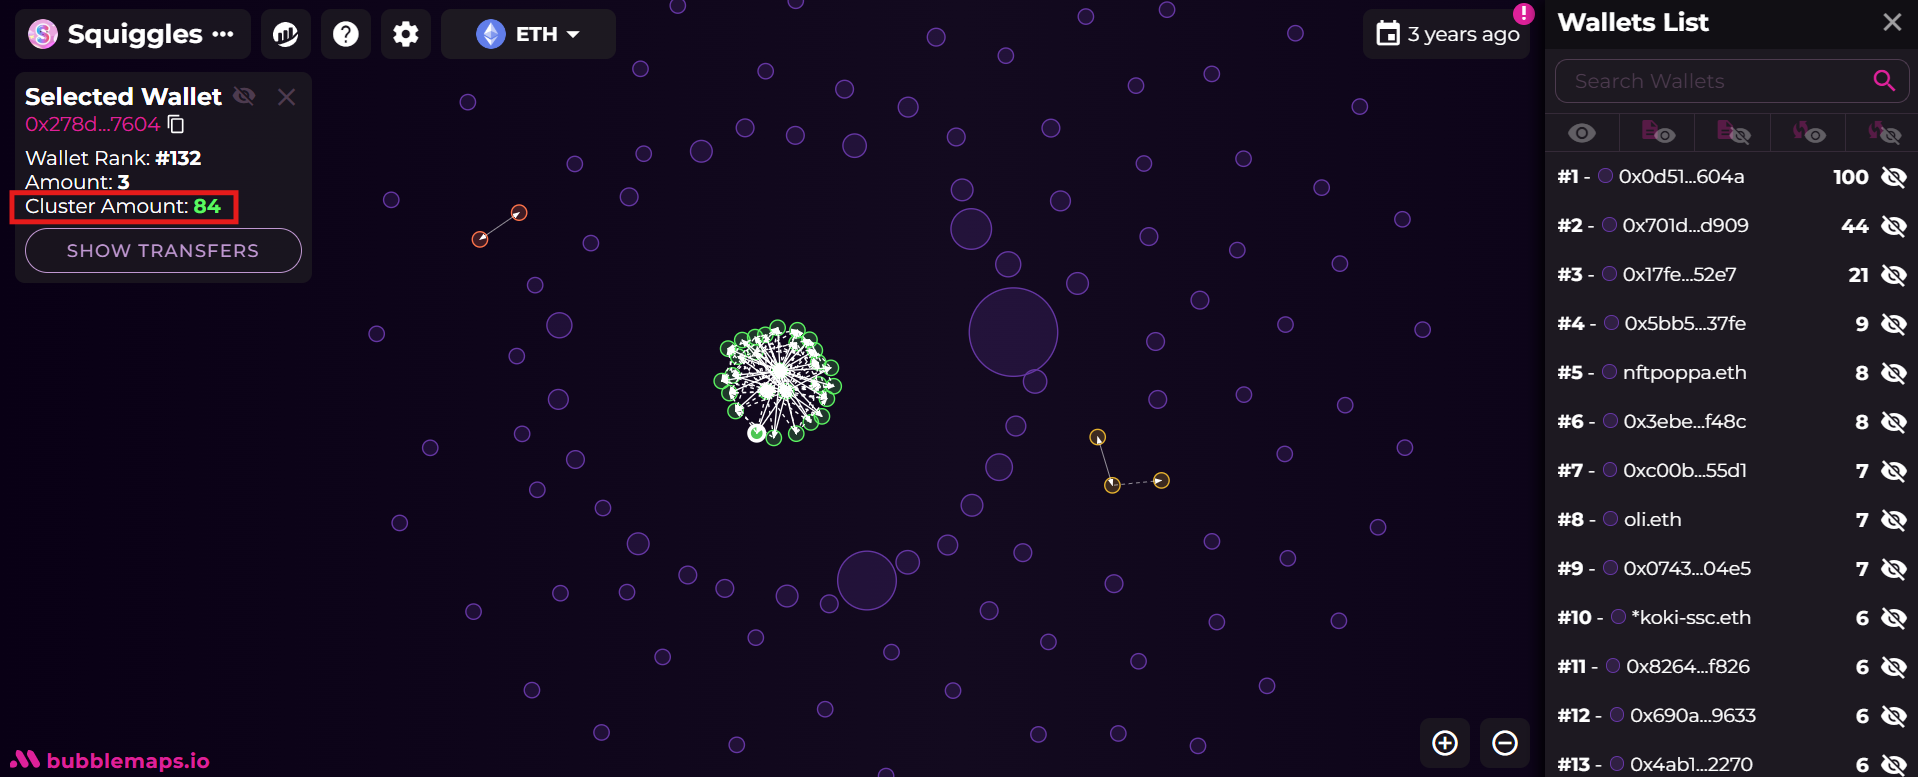
Un groupe de wallets avec des transferts répétitifs peut suggérer du wash trading, une technique visant à gonfler artificiellement le volume d’échange.
📸 Exemple : Certains projets NFT comme Squiggles ont été exposés pour wash trading. Ils pouvaient être détectés sur Bubblemaps.
Pourquoi un Projet Fortement Centralisé Peut Poser Problème ?
Un projet où une petite poignée d’acteurs détient une large partie des tokens peut poser plusieurs risques pour les investisseurs :
📌 Pouvoir de contrôle élevé
Si une seule entité ou un groupe restreint détient une part significative des tokens, cela leur donne un pouvoir disproportionné sur le projet. Cela peut inclure :
✔️ La manipulation des votes dans une gouvernance décentralisée (DAO).
✔️ La possibilité de vendre en masse et de provoquer un krach.
✔️ Une asymétrie d’informations où les insiders bénéficient d’un avantage sur le reste du marché.
📌 Volatilité accrue et risque de dump
Si l’équipe ou des early investors détiennent une majorité des tokens, cela signifie que lorsque leur vesting expire, ils peuvent vendre massivement, entraînant une chute brutale du prix.
📌 Faible adoption organique
Un token trop centralisé peut manquer de participation active car la majorité des tokens restent aux mains de quelques acteurs. Cela peut limiter l’intérêt pour le projet et ralentir son adoption.
Étude de Cas : Analyse de Jupiter (JUP) sur Bubblemaps
Après avoir exploré le fonctionnement général de Bubblemaps, nous allons illustrer son utilité avec une étude de cas concrète : l’analyse de Jupiter (JUP), l’un des tokens majeurs de l’écosystème Solana. Cette étude nous aidera à mieux comprendre comment interpréter les données affichées et éviter les erreurs d’interprétation liées à la distinction entre l’offre en circulation et l’offre totale.
Ce que Bubblemaps Montre sur Jupiter
En sélectionnant Jupiter (JUP) sur Solana, Bubblemaps affiche plusieurs clusters de wallets qui détiennent une part significative des tokens :
- Les cold et hot wallets de l’équipe Jupiter détiennent environ 45 % des tokens.
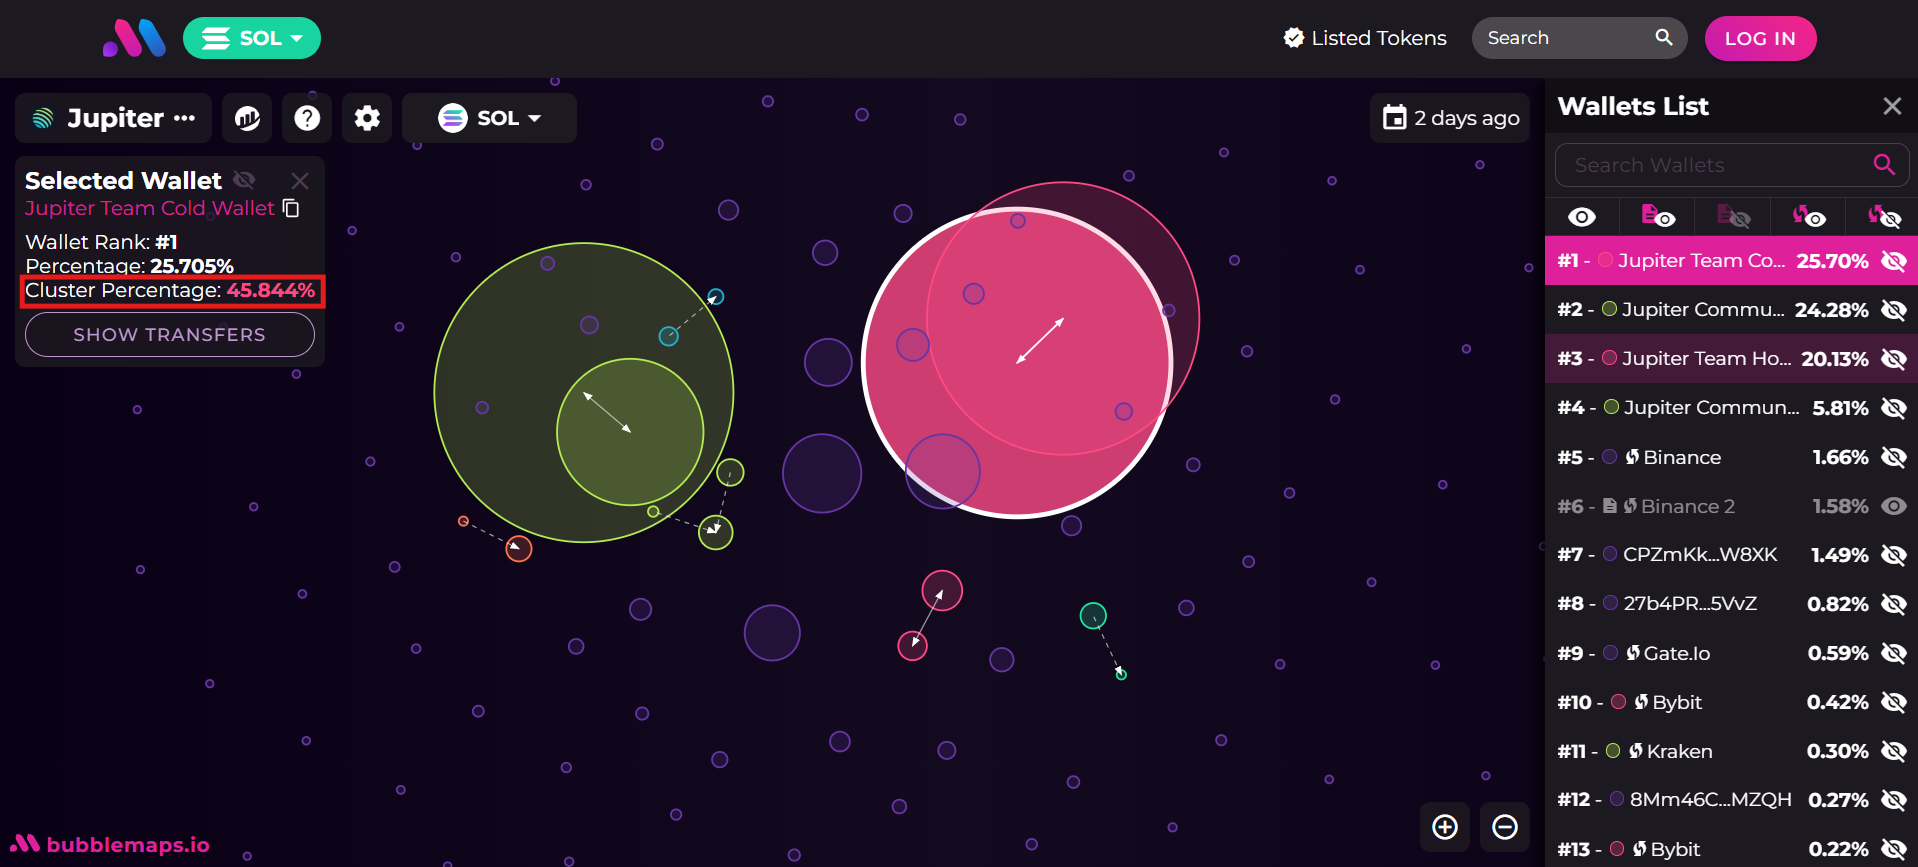
- Les hot et cold wallets liés à la communauté contrôle environ 30 %.
- Certains exchanges centralisés (CEX) comme Binance possèdent environ 1,66 % de l’offre.
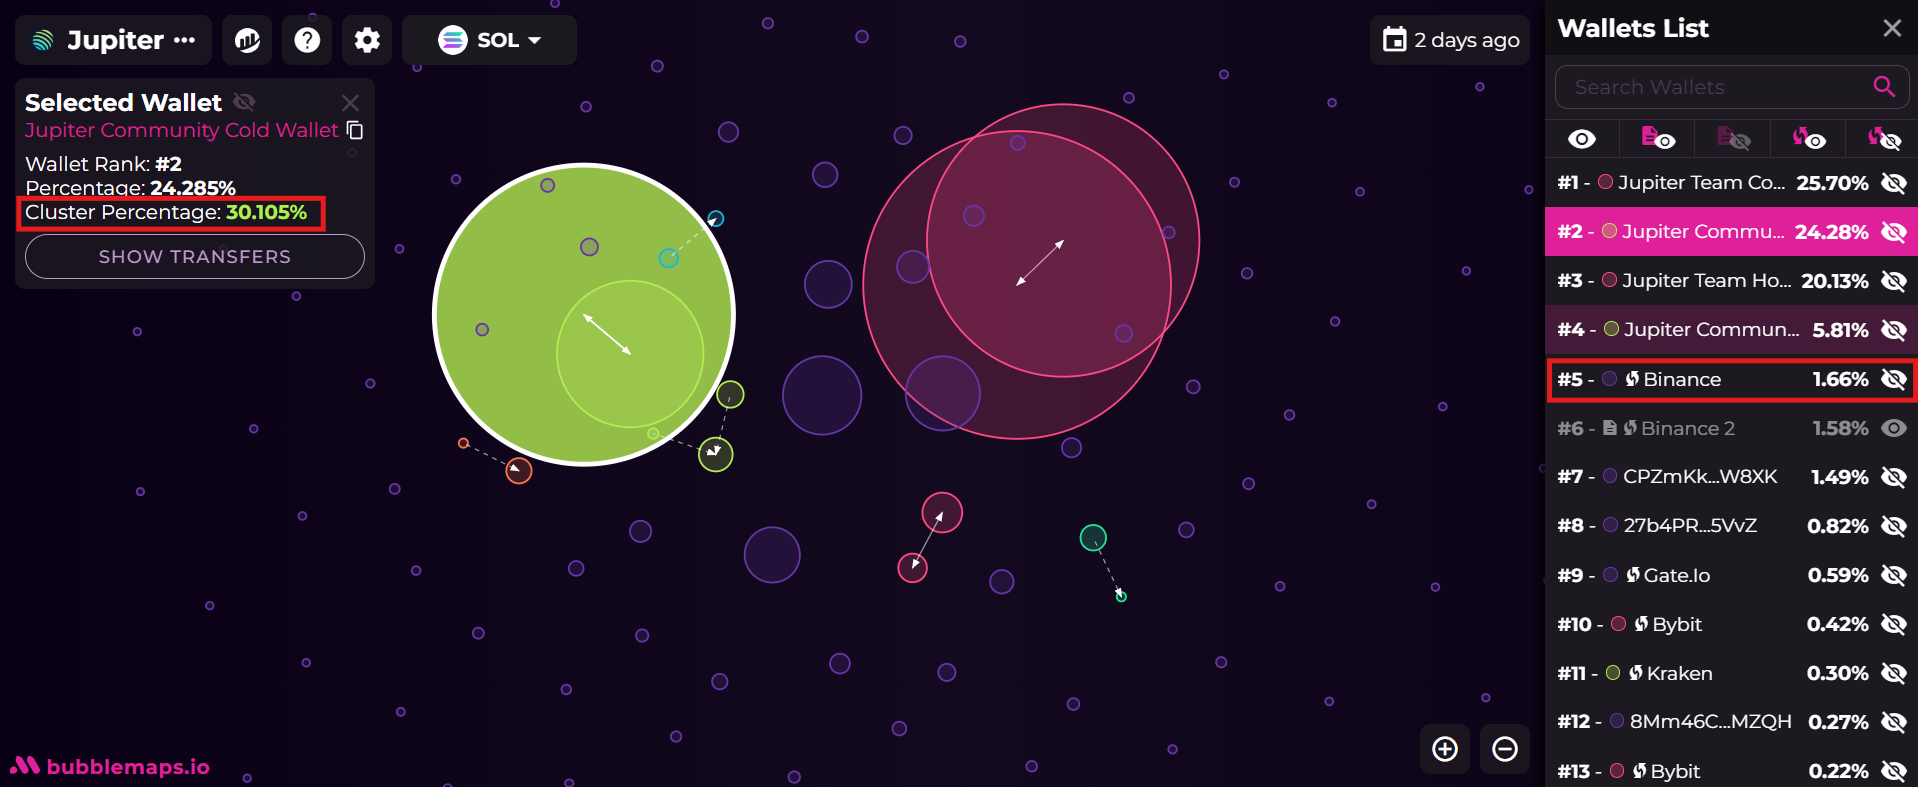
🔎 Problème d’interprétation détecté :
Ces pourcentages sont basés sur l’offre totale de JUP (7 milliards de tokens) et non sur l’offre en circulation. Actuellement, seulement 1,7 milliard de JUP sont en circulation. Cela signifie que la majorité des tokens visibles sur Bubblemaps sont encore verrouillés et ne sont pas réellement disponibles sur le marché.
➡️ Pourquoi est-ce important ?
Un investisseur qui ne prend en compte que la répartition des wallets sur Bubblemaps pourrait surestimer la liquidité réelle du token. Certains tokens sont verrouillés dans des contrats de vesting, des réserves stratégiques ou des fonds communautaires, ce qui empêche leur vente immédiate.
Qu’est-ce que la Communauté dans un Projet Crypto ?
Dans les cryptomonnaies, la communauté est un terme large qui regroupe généralement les utilisateurs, investisseurs et contributeurs actifs autour du projet. Cela peut inclure :
- Les utilisateurs du protocole (traders, développeurs, holders de tokens).
- Les participants aux DAO (gouvernance décentralisée).
- Les membres de l’écosystème bénéficiant de subventions, d’incitations ou d’airdrops.
Cependant, dans de nombreux projets, les fonds communautaires sont en réalité sous le contrôle de l’équipe ou d’un groupe restreint, avec une libération progressive suivant un calendrier de vesting.
📌 Dans le cas de Jupiter (JUP), une grande partie des tokens classés comme “fonds communautaires” est encore verrouillée, ce qui signifie qu’ils ne sont pas réellement entre les mains des investisseurs individuels, mais plutôt réservés pour des allocations futures.
Déterminer l’Offre Réelle : Croisement des Données avec Arkham et Tokenomist
Afin d’obtenir une vue plus précise de l’état réel de l’offre de JUP, nous avons croisé les données de Bubblemaps, Arkham et Tokenomist.
📌 Étape 1 : Vérification des fonds sur Arkham
Arkham nous permet d’identifier le wallet de l’équipe Jupiter qui détient 30 % des tokens sur Bubblemaps. En consultant son solde, nous trouvons environ 2,1 milliards de JUP.
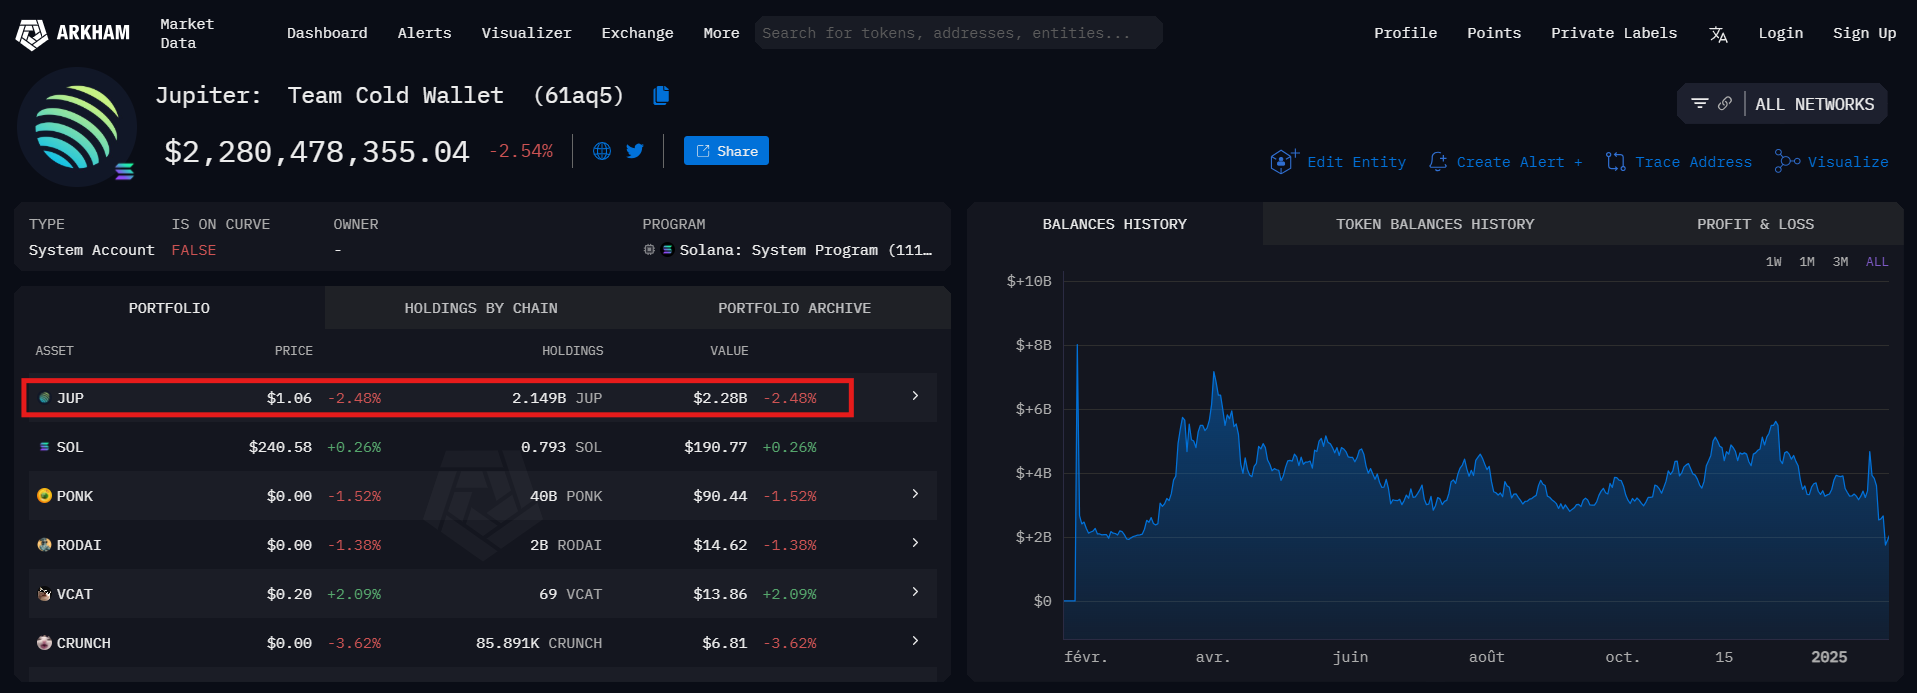
➡️ Interprétation :
Cela représente bien 30 % de l’offre totale de 7 milliards de JUP, ce qui confirme que Bubblemaps affiche l’offre totale et non l’offre en circulation.
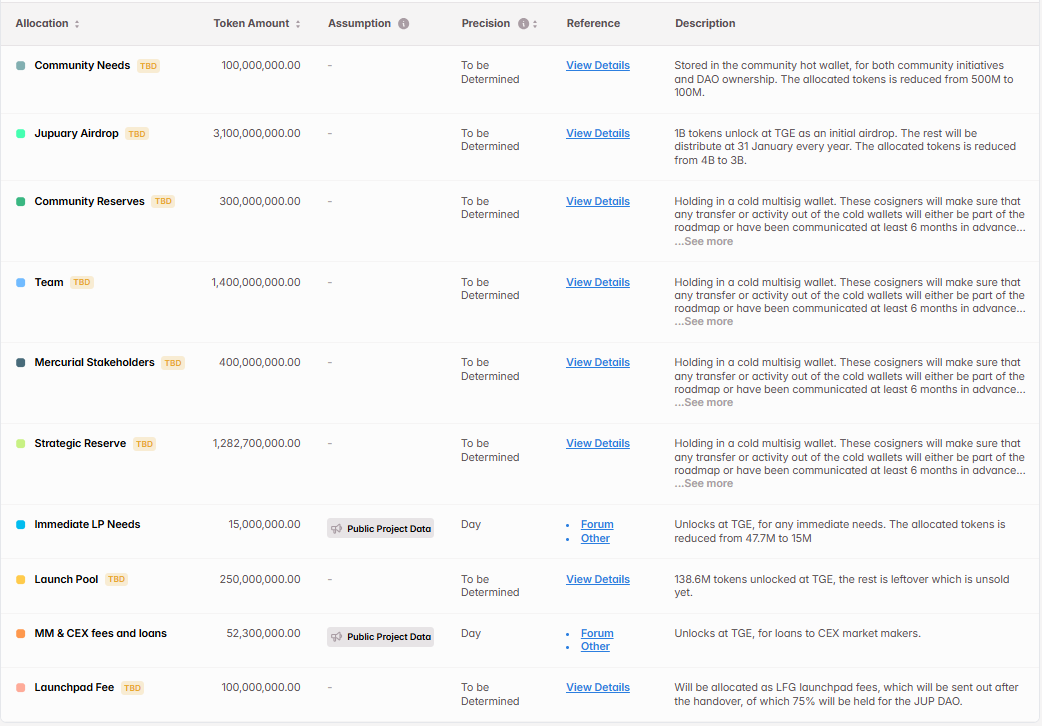
📌 Étape 2 : Vérification de l’offre totale et en circulation sur Tokenomist
Tokenomist fournit des informations détaillées sur la répartition et le vesting des tokens. Voici ce que l’on y observe :
- 73 % de la supply totale est encore verrouillée (soit 5,09 milliards de JUP).
- Ces tokens sont répartis dans différentes catégories avec des périodes de libération progressives.
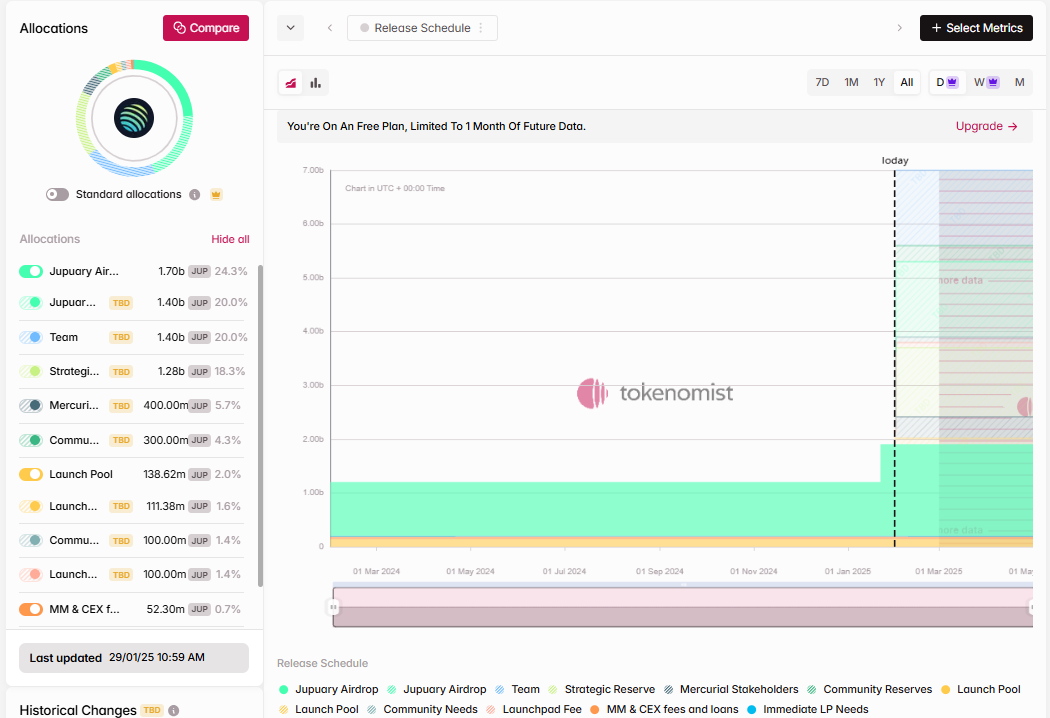
➡️ Conclusion :
Les tokens visibles sur Bubblemaps incluent les tokens encore bloqués, ce qui peut donner une impression erronée de la liquidité réelle du projet si l’on ne croise pas les données.
Recommandation : Toujours Croiser les Données
💡 Ne pas se fier uniquement aux clusters affichés sur Bubblemaps.
Avant d’investir, il est essentiel de :
✔️ Vérifier les fonds sur Arkham pour confirmer l’appartenance des wallets.
✔️ Analyser l’offre en circulation sur Tokenomist pour éviter de surestimer la liquidité.
✔️ Surveiller les périodes de vesting pour anticiper d’éventuelles pressions vendeuses.
✔️ Analyser les flux de transactions pour détecter d’éventuelles manipulations de marché comme le wash trading.
Comparaison et Implications pour l’Analyse On-Chain
En croisant les données des différents outils, voici une répartition plus précise de l’offre totale vs l’offre en circulation et ce que chaque outil apporte à l’analyse :
| Outil | Information Principale |
|---|---|
| Bubblemaps | Visualise la répartition des wallets sur l’offre totale, y compris les fonds verrouillés généralement. |
| Tokenomist | Détaille la répartition des fonds avec une catégorisation précise (équipe, communauté, réserve stratégique). Confirme que 73 % des tokens sont bloqués sans calendrier de libération défini. |
| Arkham | Permet d’identifier les entités derrière les wallets visibles sur Bubblemaps (équipe, exchanges, DAOs, investisseurs). Confirme que l’adresse repérée sur Bubblemaps (30 % des tokens) correspond bien à l’équipe Jupiter. |
| CoinMarketCap (optionnel si Tokenomist est disponible) | Indique que seulement 1,7 milliard de JUP sont en circulation, aidant à éviter les erreurs d’interprétation sur la liquidité réelle du marché. |
📌 Implications pour l’analyse on-chain :
✔️ Ne pas confondre l’offre totale et l’offre en circulation pour éviter une mauvaise estimation de la liquidité réelle du token.
✔️ Utiliser Arkham pour attribuer les wallets et éviter de supposer que certains fonds sont accessibles alors qu’ils appartiennent à des contrats verrouillés.
✔️ Analyser les calendriers de vesting sur Tokenomist pour anticiper d’éventuelles pressions vendeuses lorsque les fonds bloqués seront libérés.
✔️ Observer les flux entre les wallets d’équipe et les exchanges pour détecter d’éventuelles ventes stratégiques ou une redistribution progressive des tokens sur le marché.
Conclusion sur Bubblemaps
Bubblemaps est un outil pertinent pour visualiser la répartition des tokens et comprendre comment un projet est structuré.
Il est important également de noter que certains tokens sont compatibles avec plusieurs blockchains. Ainsi, une analyse complète ne peut être réalisée qu’en explorant la répartition du token sur l’ensemble des blockchains compatibles du token.
Pour une véritable compréhension de la répartition des tokens, il est essentiel de croiser ses analyses avec d’autres plateformes comme Tokenomist et Arkham afin d’éviter les erreurs d’interprétation sur l’offre réellement disponible.
✅ Un projet peut sembler très centralisé alors que ses fonds sont verrouillés, ou inversement.
✅ Un investisseur avisé doit toujours analyser la liquidité réelle et les périodes de libération des tokens.
Les investissements dans les crypto-monnaies sont risqués. Crypternon ne pourrait être tenu responsable, directement ou indirectement, pour tout dommage ou perte causé suite à l’utilisation d’un bien ou service mis en avant dans cet article. Les lecteurs doivent faire leurs propres recherches avant d’entreprendre toute action et n’investir que dans les limites de leurs capacités financières. Les performances passées ne garantissent pas les résultats futurs. Cet article ne constitue pas un conseil en investissement.
Certains liens de cet article sont affiliés, ce qui signifie que si vous achetez un produit ou vous inscrivez via ces liens, nous percevrons une commission de la part de notre partenaire. Ces commissions n’entraînent aucun coût supplémentaire pour vous en tant qu’utilisateur et certains partenariats vous permettent d’accéder à des promotions.
Recommandations de l’AMF. Il n’existe pas de rendement élevé garanti, un produit présentant un potentiel de rendement élevé implique un risque élevé. Cette prise de risque doit être en adéquation avec votre projet, votre horizon de placement et votre capacité à perdre une partie de cette épargne. N’investissez pas si vous n’êtes pas prêt à perdre tout ou partie de votre capital.
Pour aller plus loin, lisez nos pages Mentions Légales, Politique de confidentialité et Conditions générales d’utilisation.

Crypternon
Ingénieur de formation, je me suis rapidement intéressé au domaine de la finance. Convaincu que la finance décentralisée a de beaux jours devant elle, je participe à sa démocratisation en développant Crypternon.