Easy
Bullish RSI divergence: understanding and exploiting this signal in trading
The bullish RSI divergence is a concept often discussed in trading to anticipate a possible upward trend reversal. This article presents RSI divergence , specifically bullish divergence , explaining how it works, its limitations, and offering some suggestions on how to use divergences in a trading strategy .
Table of contents
What is an RSI divergence?
A divergence occurs when the direction of the price trend and that of the RSI are not aligned. The RSI is a technical indicator in technical analysis overbought and oversold zones for an asset .
In concrete terms, a divergence appears when:
- when the price of an asset reaches a new low or high,
- while the RSI does not confirm this movement by displaying a different low or high.
This difference between the price and the RSI can be seen as a warning signal, suggesting a possible change in market dynamics. The RSI shows that the downward momentum may be losing steam, which could signal a bullish reversal or the end of a downtrend . Therefore, exploiting bullish divergences is a common practice among retail traders to anticipate an upward move. Two types of divergences are generally distinguished :
- Bullish divergence : potential signal of a reversal towards an uptrend .
- Bearish divergence : potential signal of a reversal towards a bearish trend .
Classic bullish divergence and hidden bullish divergence
Two main forms of bullish divergence are often distinguished:
- Classic bullish divergence : the price makes a lower low, while the RSI makes a higher low. This type of divergence is the most common and is frequently used to detect a reversal.
- Hidden bullish divergence : This occurs when the price makes a higher low, but the RSI makes a lower low. This hidden divergence can indicate a possible continuation of the current uptrend
Hidden divergences are less frequent but can offer clues about the strength of a trend.
How to identify a bullish RSI divergence?
To exploit divergences in trading how to identify signals on charts by analyzing price and RSI . Here's one method:
- Identify the successive price troughs on the chart.
- Identify the corresponding troughs in the RSI over the same period.
- Compare the direction of price troughs and the RSI :
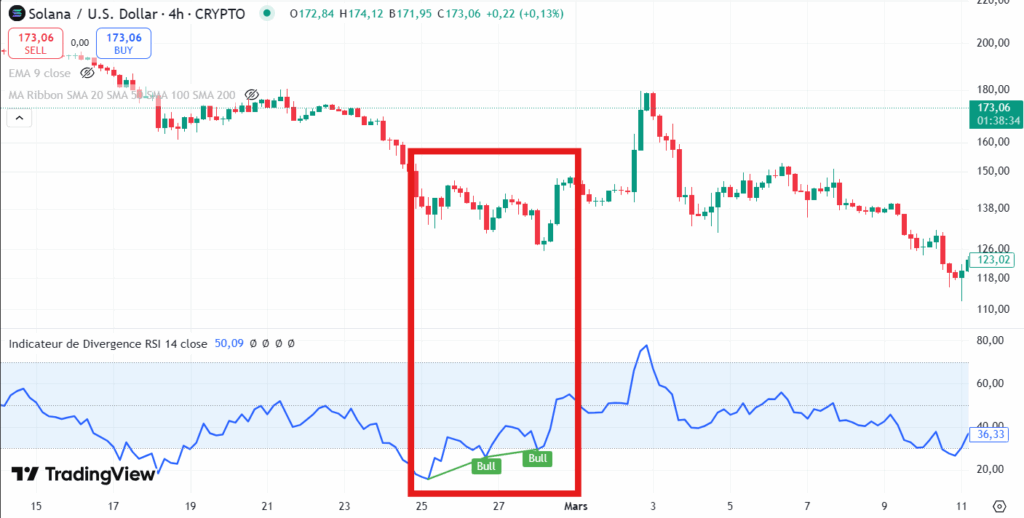
- If the price makes a lower low and the RSI makes a higher low, this corresponds to a bullish divergence .
- If the price makes a higher low and the RSI makes a lower low, this is a hidden bullish divergence .
Observing when the RSI enters the oversold zone (generally below 30) can strengthen the signal's validity. In this context, the bullish divergence is often perceived as more reliable.
Using RSI and divergences in trading
The RSI is a popular indicator trading world due to its simplicity and relative effectiveness. RSI divergences are often considered tools for anticipating trend reversals and refining trading decisions .
Some common uses of the RSI bullish divergence by traders :
- Reversal confirmation : a bullish divergence can be interpreted as a sign that the downtrend could reverse.
- Entry into a position : some traders wait for a bullish divergence before entering long position
- Exiting a position : this signal can also be seen as an indication of the end of a downward phase, suggesting taking profits or limiting losses.
The divergence strategy RSI readings with other indicators such as Bollinger Bands , moving averages, or volumes to improve the reliability of signals.
Example of using RSI with other indicators
To reduce the risk of false signals, one approach is to combine the RSI with:
- Moving averages, in order to confirm the direction of the general trend.
- Support and resistance levels, to identify key price levels
- The volumes, to validate the strength of the movement.
This combination of tools can help to exploit divergences with more caution and precision.
Differences between bullish divergence and bearish divergence
Divergences can be bullish or bearish, each potentially indicating a reversal in the opposite direction :
- Bullish divergence : the price falls while the RSI rises, suggesting a possible rebound.
- Bearish divergence : the price rises while the RSI falls, signaling a risk of a downward .
A bearish divergence occurs when the price makes higher highs while the RSI makes lower highs. This signal can be just as relevant as a bullish divergence for anticipating trends .
Limitations and precautions with RSI divergence
Like any indicator , the RSI and divergences do not guarantee consistent success. A few observations:
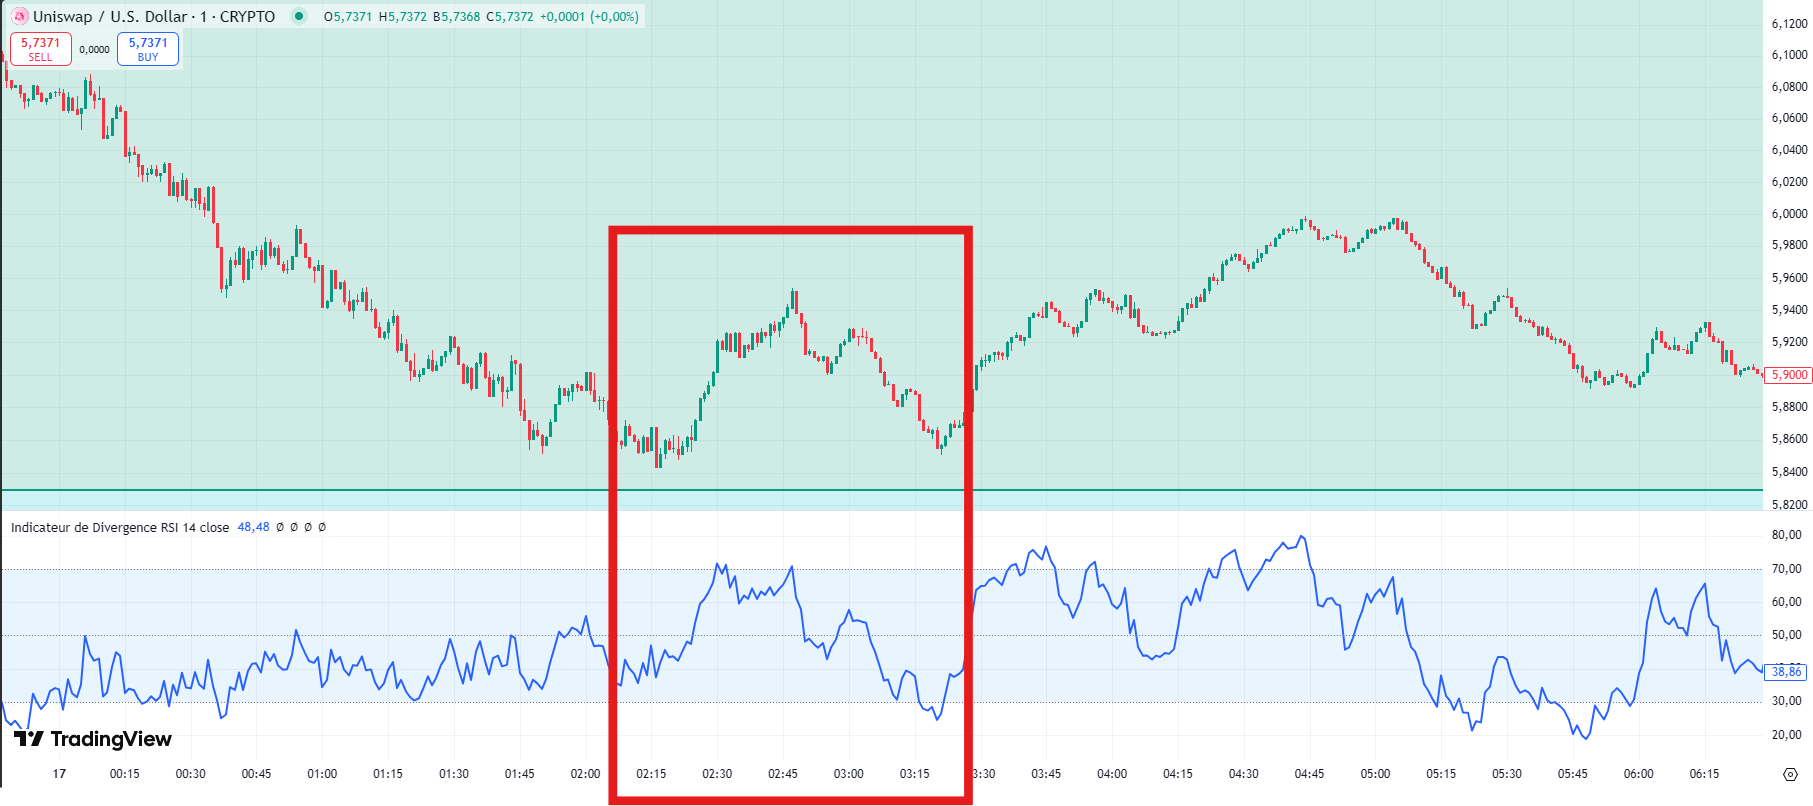
- A divergence can last for some time before the price actually reacts.
- Signals can be contradicted by the strength of a dominant trend; here is an example :
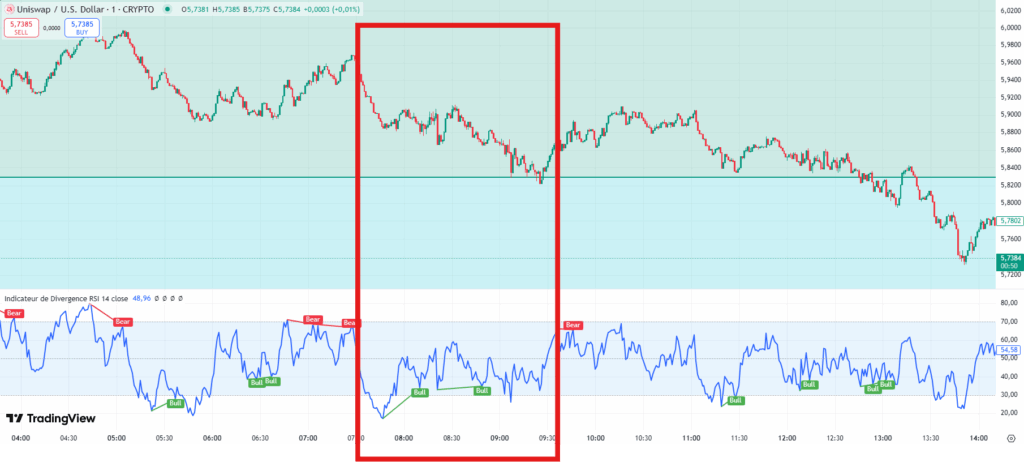
- Divergence trading may require rigorous risk management and well-placed stops.
- The overall context of financial markets can influence the relevance of signals.
More advanced trading often incorporates these elements to limit errors in interpretation.
Incorporating the RSI bullish divergence into a trading strategy
A method for using the RSI bullish divergence :
- Identify a downward trend on the chart.
- Identify a classic or hidden bullish divergence on the RSI .
- Confirm the signal with another technical indicator (moving average, volume, support).
- Enter a long position when the price shows signs of rebounding.
- Place a stop-loss below the last low to limit potential losses.
- Monitor the position and adjust the stop according to market developments.
This approach can help optimize inputs while limiting the risks associated with false signals.
Conclusion
The bullish RSI divergence appears to be a useful tool for detecting a potential reversal from a downtrend to an uptrend RSI analysis with other indicators and careful risk management, some traders can refine their trading decisions and better anticipate market movements.
To further develop mastery of RSI and trading strategies , it may be relevant to experiment on trading platforms offering powerful graphical tools and to test different combinations of indicators .
Investments in cryptocurrencies are risky. Crypternon could not be held responsible, directly or indirectly, for any damage or loss caused following the use of a property or service put forward in this article. Readers must do their own research before undertaking any action and investing only within the limits of their financial capacities. Past performance does not guarantee future results. This article does not constitute an investment .
Certain links of this article are sponsorship links, which means that if you buy a product or you register via these links, we will collect a commission on the part of the sponsored company. These commissions do not train any additional cost for you as a user and certain sponsorships allow you to access promotions.
AMF Recommendations. There is no guaranteed high return; a product with high potential returns implies high risk. This risk must be commensurate with your investment goals, your investment horizon, and your ability to lose some of your savings. Do not invest if you are not prepared to lose all or part of your capital.
All our articles are subject to a rigorous verification of the facts. Each key information is verified manually from reliable and recognized sources. When we cite a source, the link is systematically integrated into the text and highlighted by a different color, in order to guarantee transparency and allow the reader to consult the original documents directly.
To go further, read our pages legal notices , privacy policy and general conditions of use .

Yoann
Training engineer, I quickly became interested in the field of finance. Convinced that decentralized finance has a bright future ahead of it, I participate in its democratization by developing Crypternon.