

Easy
How long does a bull run last?
A bull run in the cryptocurrency market refers to a prolonged period of rising prices, during which the market climbs steadily and rapidly. Looking at past cycles of Bitcoin and other cryptocurrencies, we see that this type of bull market can last for several months, or even more than a year. Strong valuations often culminate in a peak known as an all-time high (ATH). The main point in this introduction is that growth cycles typically last between 12 and 18 months for Bitcoin, while some cryptocurrencies ltc experience shorter or longer periods depending on their fundamentals and volatility.
Table of Contents
How long does a bull run last? Key factors in a cryptocurrency bull market
When the cryptocurrency market enters a phase of exponential growth , it is associated with a behavior known as a " bull run " or bull market . The reasons for this upward trend can include:
- Increased demand due to interest from institutional and individual investors
- Specific events, such as the Bitcoin block reward halving
- Macroeconomic conditions that favor speculation on digital assets
- The evolution of fundamentals related to blockchain projects (use cases, adoption, protocol updates)
- A limited supply in circulation and the number of tokens available
One way to understand how long a bull run is to analyze the context: market sentiment, liquidity flowing into trading platforms, technological innovations, and media attention. The characteristics remain similar in each cycle, but the duration can differ depending on the maturity of the ecosystem and the strength of the projects driving the growth .
How long does a bull run last? Precisely defining the start and end of a bull run
To determine the duration of a bull run one must ask at what point it can be confirmed that the market has entered an upward phase. Several criteria are generally used:
- A sustained increase over several weeks, accompanied by significant volumes
- Positive announcements or strong media attention reinforce market sentiment
As for the end, it is often characterized by a very rapid final rise (blow-off top), followed by a sharp correction. When a new all-time high (ATH) is reached, but the momentum is lost, the risk of a bear market increases, thus marking the end of the bull run. In this article, the approach is to consider a bull run as the period from the bullish breakout of a key level (with increasing volume) to the absolute peak observed before a prolonged reversal.
How long does a bull run last: Understanding Bitcoin's history and its bull market phases
Bitcoin is often used as a benchmark to determine the duration of a bull run in the crypto world. Indeed, its large market capitalization and its role as the "mother of cryptocurrencies" greatly influence overall trends.
To gain a deeper understanding of how the monetary system and Bitcoin work, and to develop a more complete mastery of the tools, finance and legal constraints (taxation, inheritance, etc.) , we invite you to discover the BSM program .
It includes detailed video tutorials on centralized exchanges, software wallets, hardware wallets, and best practices. The program can be accessed from the header or the link above.
Here is an overview of the main historical bull cycles BTC , which often serve as a benchmark for the entire market.
Cycle 2010–2011
Duration and growth
Bitcoin's first significant cycle began in 2010, when its price rose from less than one dollar to over 30 dollars. The period highlighted in red lasted just under two months (1 month and 26 days).
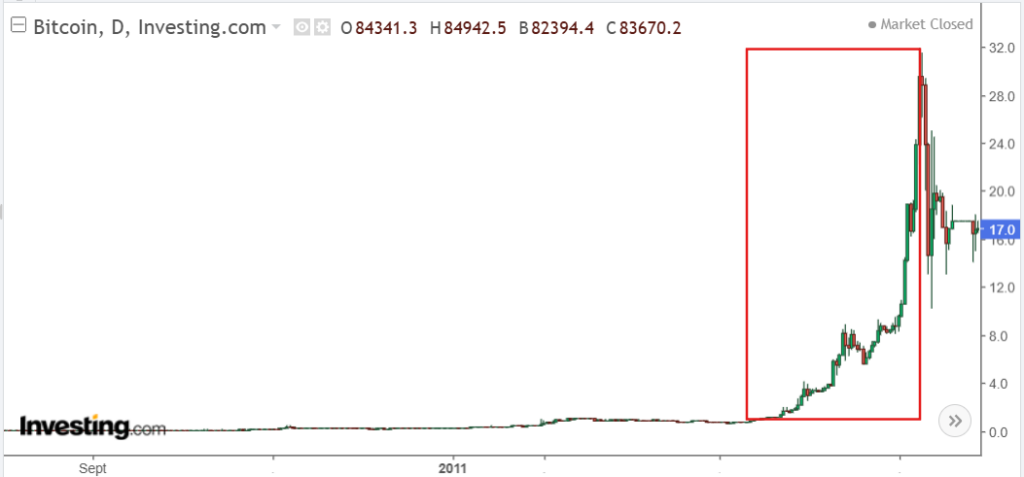
During this period, volatility was extremely high and the market was very illiquid.
This cycle remains a textbook case, as the price of Bitcoin was still very low and capitalization limited. Speculation came primarily from blockchain technology enthusiasts.
More information about the rewards can be found here.
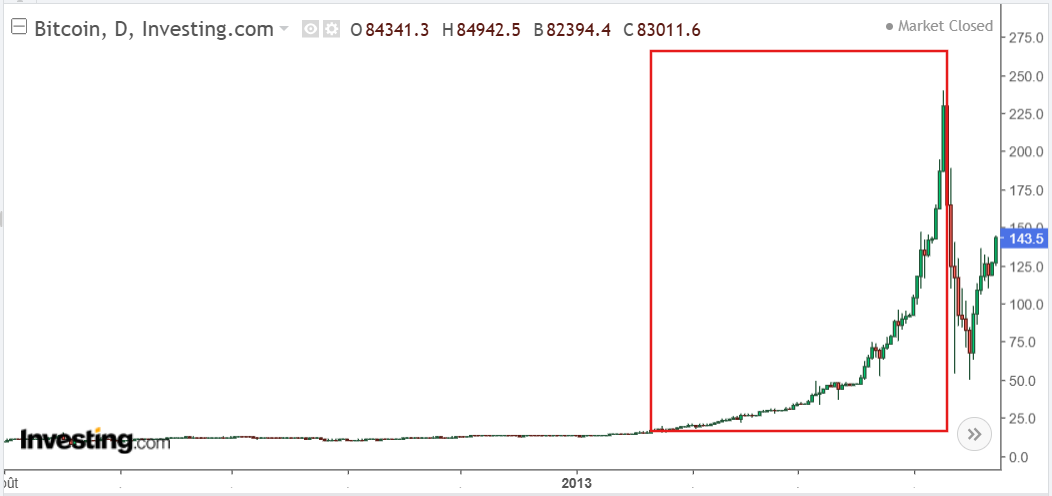
Cycle 2011-2013
Duration and growth
The upward trend can be traced back to its lowest point of $2 around November 2011. From that moment until April 2013, Bitcoin rose to over $250.
The period of extreme rise highlighted in red lasted just under 3 months.
2013-2014 Cycle
An exponential growth followed by a bear market
During 2013, Bitcoin experienced a spectacular surge, rising from a range of $50 to $100 to over $1,000 by the end of the year. This growth unfolded over approximately 12 months, with a particularly significant increase during two months. Many new investors flocked to the market, attracted by the promise of quick returns. However, at the end of 2013, the market experienced a sharp decline, marking the beginning of a bear market that lasted for almost all of 2014 and part of 2015.
- The bull run begins: the price breaks above $100 with high volume
- End: reached over $1200, followed by a rapid fall
- Duration: 2 months of solid progress
This cycle is often cited to show that the more capitalization grows, the more its speculative appeal attracts crowds of new investors, thus prolonging the growth phase until the market saturates.

Cycle 2015 – 2017
From stagnation to a historic record in 2017
After a long bear market in 2014, Bitcoin fell back to around $200 in early 2015. The start of the new bull run when the price broke through the $300 mark with sustained upward momentum in late 2015. The surge accelerated during 2016 with the influx of new capital and renewed media interest. The real exponential rise occurred in 2017, driven by:
- Extensive media coverage
- The rise of ltc Ethereum other LTCs
- The discovery of blockchain by institutional investors
- The desire for massive participation from small investors
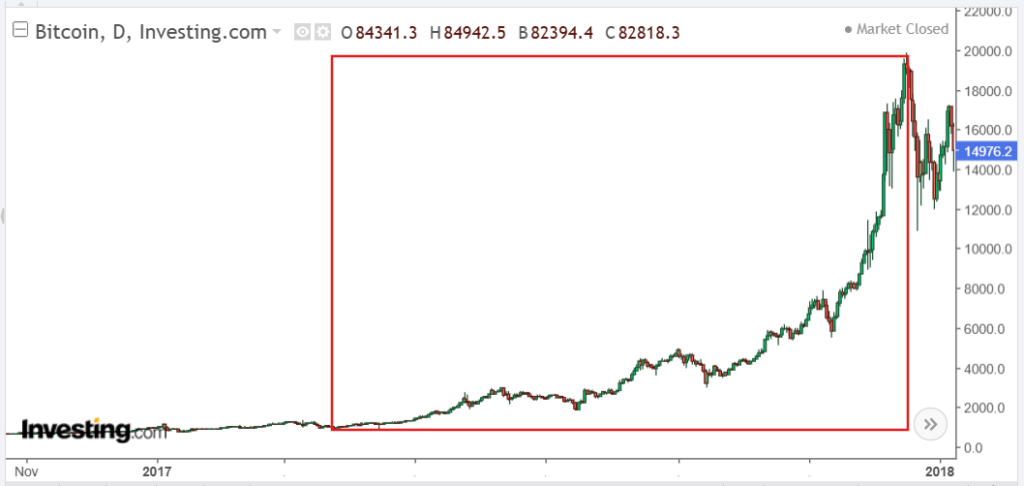
The peak reached nearly $20,000 in December 2017. Over this cycle, the growth from the starting point of $200 to $20,000 spanned approximately two years. However, the sharp upward (2017) lasted nine months, during which Bitcoin rose from around $900 to $20,000.
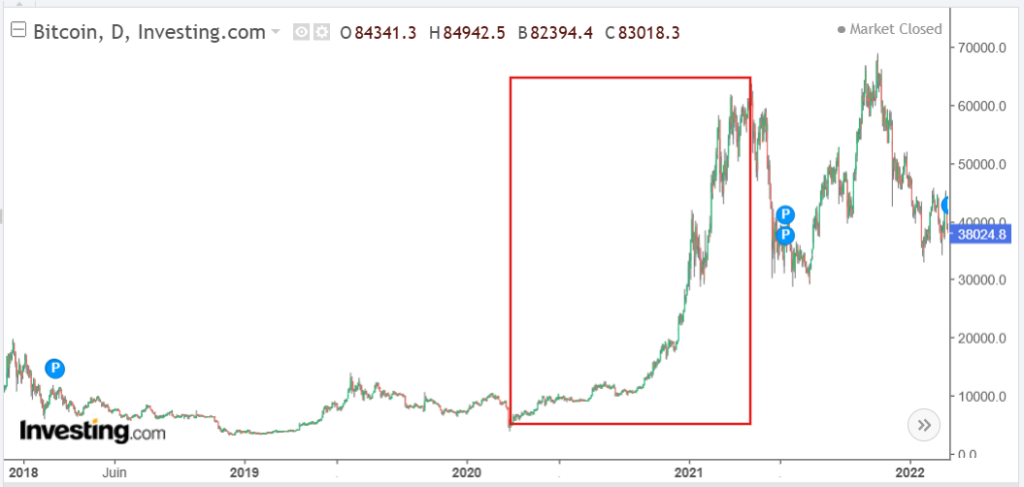
Cycle 2018 – 2021
The biggest bull run in Bitcoin history
After the euphoria of late 2017, the market entered a bear market throughout 2018, pushing Bitcoin back below $4,000. 2019 saw a gradual recovery, reaching around $13,000, before another correction. The true start of the bull run is often dated to March 2020, when Bitcoin fell back to around $4,000 during the pandemic-related panic. From that point until November 2021, Bitcoin climbed above $68,000. It's worth noting that this bull run was somewhat different due to two very closely spaced peaks.
- Estimated start: massive rebound in March 2020 above $4,000-$5,000
- End: All-time high of $68,000 at the end of 2021, followed by a sharp correction
- Total duration: approximately 20 months and a strong sustained rise for 1 year and 1 month if we take the first peak as a reference.
institutional participation was a key factor, with some companies beginning to incorporate Bitcoin into their treasury. Derivatives markets, margin trading, and the expansion of exchange platforms also contributed to the trend .
How long does a bull run last: Analysis of average durations for Bitcoin
To determine the duration of a bull run more concretely, we can base our analysis on the exponential rises of Bitcoin's 5 major cycles:
- Cycle 2010 – 2011: approximately 2 months
- Cycle 2011 – 2013: approximately 3 months
- Cycle 2013 – 2014: approximately 2 months
- Cycle 2014 – 2017: approximately 9 months
- Cycle 2017 – 2021: approximately 1 year and 1 month
We have noticed that the duration of the climbs tends to be longer. Several factors can explain this trend:
- The adoption of Bitcoin and crypto-assets
- The increase in volumes makes markets more liquid and less sensitive to ultra-rapid fluctuations
- The participation of institutional investors , which supports prices in the long term
- The repetition of cyclical patterns linked to the block reward halving (approximately every 4 years) which are becoming less and less significant
Generally speaking, it is becoming common to estimate that a Bitcoin bull market lasts between 12 and 18 months, with variability depending on macroeconomic conditions and the speed of adoption.
How long does a bull run last: A scientific approach and numerical data
To adopt a more scientific perspective, it is necessary to compile historical data to identify quantifiable trends. According to the historical data available on CoinMarketCap , here are some quantitative elements:
- Over the past 10 years, Bitcoin has experienced an average cycle peak every 3 to 4 years.
- The time between the major post-bull run low and the next all-time high has varied between 2 and 3 years
- The longest bull run lasted approximately 20 months (2020-2021)
Analyzing the distribution of returns on investment (ROI) during these periods reveals an exponential increase during bull markets, followed by a correction of up to 70-85% for Bitcoin (and sometimes more for altcoins ltc when the cycle shifts to a bear market . Examining these figures reinforces the idea that resilience depends largely on crypto holders' faith in the project's fundamentals.
How long does a bull run last? Variables influencing the duration of a bull run
The question “ how long does a bull run ?” also involves understanding the mechanisms that can shorten or prolong an upward cycle. Key elements include:
- The economic situation : in a period of high interest rates and monetary tightening, speculation tends to subside.
- Technological advancements (protocol updates, new features): for example, the arrival of staking on Ethereum stimulated investor interest in 2020 and 2021
- The role of social media and influencers: the viral effect can amplify the buying frenzy
The more a market is exposed to exogenous factors, the greater the volatility, which can shorten or prolong the strong upward . Conversely, when the market sustains itself in a collective euphoria, the bull run can last longer than expected, until a major event (macroeconomic factor, scandal, strict regulation) breaks the momentum.
More information about the rewards can be found here.
How long does a bull run last? Identifying the end of a bull market
Advanced technical indicators
To identify the end of a bull run, several analytical tools based on the history of previous cycles can be used to assess whether the bull market is coming to an end.
- The Rainbow Chart : This indicator uses colored bands to represent different market phases. When Bitcoin reaches the red zone ("Maximum Bubble Territory"), it often means the market is overheating and a correction is imminent.
- The Pi-Cycle Top Indicator : It is based on the crossover of two specific moving averages (111 days and 350 days x2). Historically, this crossover has coincided with the peak of Bitcoin's bull cycles, thus marking the end of the bull run .
- NUPL (Net Unrealized Profit/Loss) : This indicator measures the overall level of unrealized profit or loss for Bitcoin holders. A very high value (above 0.75 – the euphoric green zone) indicates excessive optimism and an increased risk of a bearish reversal.
- Funding Rates : These funding rates on futures contracts indicate traders' positioning in the market. When funding rates become excessively positive, it means that too many investors are in long positions (leveraged buying), which can trigger cascading liquidations and a sharp reversal.
- The Fear and Greed Index : This indicator synthesizes several market factors (volatility, volume, dominance, social sentiment) to assess the psychological state of investors. When this index reaches extreme levels of "Greed" or "Extreme Greed" (above 80), it often means that the market is overbought and a peak is near.
Fundamental signs and market sentiment
In addition to technical indicators, certain fundamental and psychological elements often indicate that a bull run has reached maturity:
- Exaggerated general optimism on social media and in the mainstream media : When everyone is talking about Bitcoin and cryptocurrencies are making headlines in traditional business newspapers, it's often a sign that a cycle is ending. During previous bull run , magazine covers announcing "Bitcoin at $100,000" often coincided with the peaks.
- A massive influx of new, inexperienced investors : When people without financial experience start investing en masse, driven by the fear of missing out ( FOMO ), it often signals that the market is in its final euphoric phase.
- Market saturation of new projects : At the end of a bull market, too many new tokens with no real utility flood the market, often supported by aggressive marketing strategies. This phenomenon was observed in 2017 with ICOs and in 2021 with memecoin .
- A sharp drop in trading volume : If, despite a still high price, volumes start to fall, this indicates a lack of new buyers, a sign that the momentum is losing steam.
- Regulatory tightening or negative announcements : When a market reaches a peak, regulators often begin to take a closer look. Unfavorable government announcements can hasten the end of a bull run .
How long does a bull run last? Combining technical analysis and a fundamental approach
investment decisions during a bull market, it is advisable to:
- Analyze macroeconomic trends (interest rates, inflation, monetary policies)
- Study the strength of the fundamentals : development team, adoption, liquidity
- Establish risk management strategies (stop-loss, staggered profit-taking, diversification)
One way to position oneself in a bull market is to apply dollar-cost averaging (DCA), accumulating positions steadily rather than trying to time the market. This way, the investor is less exposed to sudden fluctuations and can smooth out their purchase price.
How long does a bull run last? The limitations of the fixed cycle hypothesis
It's often said that the cryptocurrency market follows a four-year cycle, mirroring block reward halving . While this correlation has held true so far, there's no guarantee it will continue indefinitely. Major structural changes, such as central bank intervention or international legal reforms, could disrupt this cyclical dynamic.
For example, faster-than-expected mass adoption could trigger a longer bull run institutional investors now have the ability to hedge their positions using derivatives, they can also rein in market exuberance at any time.
How long does a bull run last?: Likely evolution of future bull run
As time goes on, demand for Bitcoin and the cryptocurrency market as a whole is evolving. Institutional investors, banks, and even some governments are now showing interest in this asset class. This dynamic is helping to stabilize prices somewhat and is also making these assets increasingly susceptible to market manipulation by large funds seeking liquidity by taking positions that influence market prices. Furthermore, fierce competition among smart contract ( Ethereum , BNB Chain, Avalanche , etc.) is fueling growth .
A concise answer regarding the average duration of a crypto bull run
Based on historical data and experience from previous bull markets , a nuanced answer can be given:
- For Bitcoin, the average duration of a bull market phase varies between 12 and 18 months. However, exponential phases are shorter, although they tend to smooth out and lengthen over time.
- ltcmay experience shorter rises.
- The peak is generally marked by an all-time high (ATH) followed by a sharp and rapid fall, signaling the end of the bullish phase
Cryptocurrency market fluctuations are influenced by a complex set of factors: macroeconomics, regulations, collective sentiment, technological innovation, etc.
Conclusion on how long a bull run lasts
The answer to the question “ how long does a bull run ” in cryptocurrencies depends on multiple components: price history, technical analysis, project fundamentals and macroeconomic environment.
Precisely determining the beginning and end of a bull market is a complex exercise. Breakout points generally occur during periods of massive euphoria, until a major peak is established. Experience shows that as soon as the supply of new buyers dries up or an exogenous event disrupts general confidence, a correction is triggered, marking the transition to a bear market .
In summary, a truly sustained upward trend, known as bull run can last from two months to over a year, depending on the growth phases observed in Bitcoin and other cryptocurrencies . These periods appear to lengthen and smooth out over time.
Cryptocurrency investments are risky. Crypternon cannot be held liable, directly or indirectly, for any damage or loss resulting from the use of any product or service mentioned in this article. Readers should conduct their own research before taking any action and only invest within their financial means. Past performance is not indicative of future results. This article does not constitute investment advice.
Some links in this article are referral links, which means that if you purchase a product or sign up through these links, we will receive a commission from the referred company. These commissions do not incur any additional cost to you as a user, and some referrals give you access to promotions.
AMF Recommendations. There is no guaranteed high return; a product with high potential returns implies high risk. This risk must be commensurate with your investment goals, your investment horizon, and your ability to lose some of your savings. Do not invest if you are not prepared to lose all or part of your capital .
To learn more, read our Legal Notices , Privacy Policy and Terms of Use .

Yoann
Trained as an engineer, I quickly became interested in the field of finance. Convinced that decentralized finance has a bright future, I am participating in its democratization by developing Crypternon.