Intermediate
The triangle descending in trading: definition, Bulkowski statistics and risk of manipulation
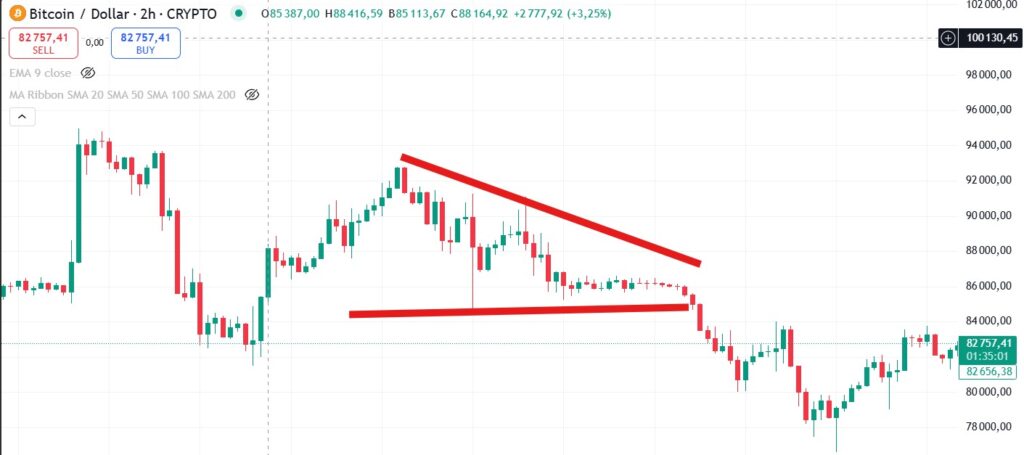
The descending triangle is a chartist figure generally associated with a potential continuation of downward trend. It is characterized by a horizontal support (lower base) and a downward resistance line (upper line). Visually, it gives the impression of a “crushing” of the summits which converge towards a fixed support. However, contrary to the received idea that this figure would mainly break down , the statistics of Thomas Bulkowski show that reality is more nuanced.
Table of contents
What is a trading triangle?
The descending triangle is spotted thanks to two main lines:
-
A horizontal support : several hollows lined up on the same level, forming a horizontal line.
-
A descending oblique resistance : lower and lower peaks, which gradually converge on this support.
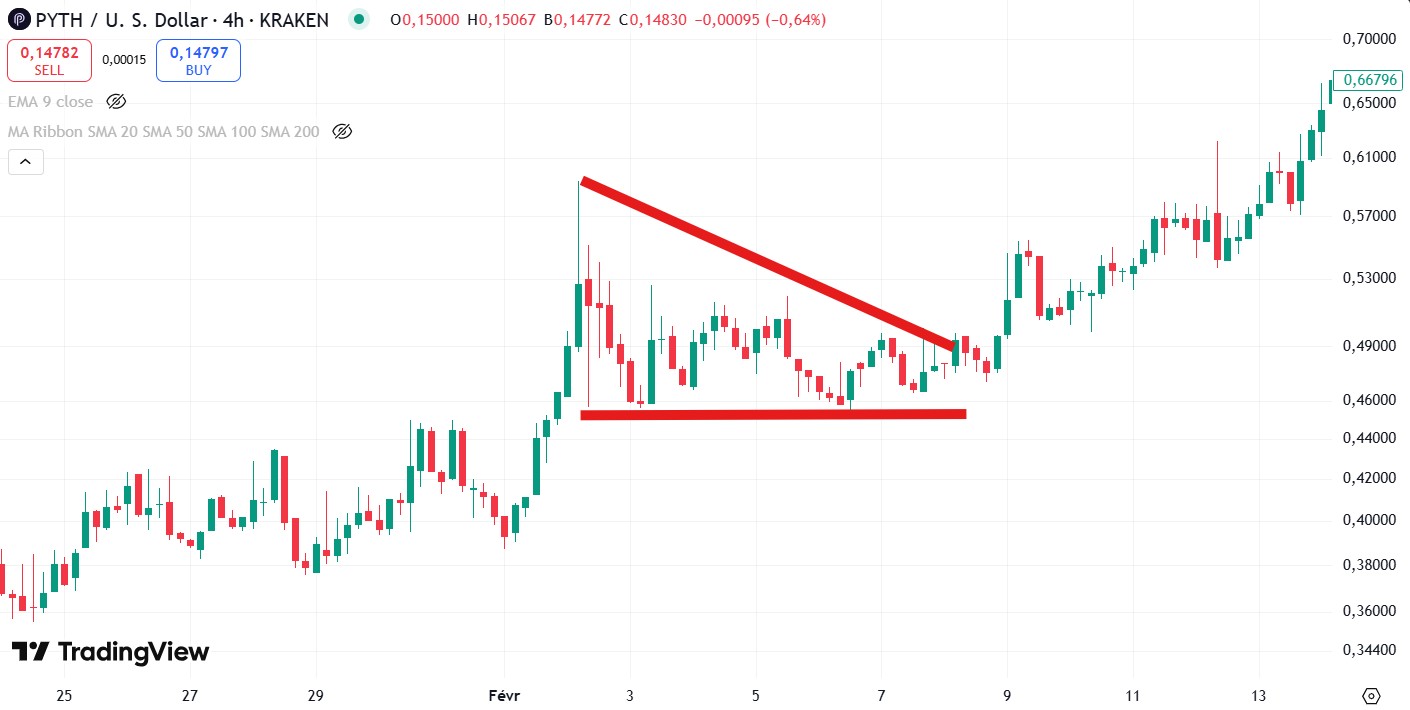
The basic hypothesis is that the sellers are gradually taking their hands, imposing decreasing peaks, while the support is resistant to the bearish pressure. When this support ends up yielding, a continuation of the decline is generally expected. However, it also happens that the course breaks from above, thus invalidating the lower aspect of the figure and opening the way to a bull movement.
The statistics of Thomas Bulkowski the triangles descending in trading
Thomas Bulkowski is the author of several works on graphic analysis, including Encyclopedia of Chart Patterns , where he lists and tests many chartist figures on a large sample of historical data. Its conclusions on the descendants (more than 1,300 cases studied) are often cited:
Probability of uptime breaks VS Down
Handy break : around 53 % of the time.
Damn break : approximately 47 % of the time.
Contrary to the popular idea that the descending triangle is essentially a downward continuation pattern, Bulkowski rather observes a slight excess of bullish breaks.
Performance after breakage
Hijacker : the average increase measured is about +38 % .
Damn break : the average drop measured is around -15 % .
Failure rate (“Break-Even Failure Rate”) :
Bullish : ~22 %.
Drop : ~23 %.
Probability of achieving the theoretical objective (rule measure):
Brazy break : ~ 64 % of cases.
Breakfast break : ~ 50 % of cases.
These statistics show that, in absolute terms, the descending triangle is not systematically a lower scheme . This does not prevent that, in practice, many traders associate it with a continuation of the downward trend, because of the very structure of the pattern (declining peaks, “hammered” support several times).
To remember : Bulkowski figures are global averages, made on historical samples. Market conditions (volatility, liquidity, feeling) and the fundamental context can influence the probability and extent of the break.
Criteria for validation and invalidation of the triangle descending trading
Validation criteria
-
Several contact points : at least three successive peaks aligned on a descending line and two hollows lined up on a horizontal line.
-
Confirmed break : the validated figure is considered when the course closes significantly above the downstream resistance (bullish break) or below the support (lower break).
-
Volume : an increase in volume during the break suggests a greater “conviction” of the stakeholders.
Invalidation criteria
-
Lack of contact points : if the construction is not sufficiently “chained” (few vertices/hollow or “empty” important between prices and lines), the triangle is not representative.
-
Reverse break : if you anticipate a bearish breakout but the course ultimately crosses the descending resistance, the lower signal is invalidated.
-
Low volume : a break without increase in volume can prove to be a false outing and strengthen the risk of invalidation.
Triangle descending in trading: potential market manipulation
In practice, certain actors ( Hedge Funds , traders with large capital, market maker S) can exploit these figures to take the opposite view from private stakeholders:
False break (“fake break”) :
The course breaks the support just below a stop-loss level, triggering forced sales (protective stops).
Quickly, the market goes upwards, trapping the sellers who came out and forcing them to buy higher.
Manipulator sweater or throtback :
After a downstream break, the price comes back to test the old support (sweater). If this movement is orchestrated to appear “too much” strong, it can push the sellers to close prematurely.
Conversely, for a bullish break, a violent return to the old resistance can make buyers doubt before starting up strongly.
Artificial support for support :
Large purchase orders can be placed near the support, delaying the break and encouraging traders to believe that the figure will break from above, while the real intention is then to sell aggressively.
Trading strategies on the descending triangle
Despite the fact that the statistics show a slight advantage to the bullish break, many traders remain focused on the downward scenario. What approaches can we adopt?
5.1 Lower break strategy (downward breakout)
Entrance : on the fence below the horizontal support, ideally with an increase in volumes.
Stop-loss : placed above the old support area (now resistance). Some prefer to offer more margin to avoid going out on a simple wick.
Objective (Rule measurement) : postpone the height of the triangle from the break. However, to keep in mind that, according to Bulkowski, only about half of the downstream breaks reach their target.
5.2 Handy break
Entrance : on the fence above the downstream resistance.
Stop-loss : just below the last hollow or under the resistance recently crossed.
Objective : postpone the height of the triangle (from support to the highest top) to the break. Studies show that ~ 64 % of bullish breaks reach the theoretical objective.
5.3 Pullback or throwback
Thigh entry : wait for a retest (sweater or throwback) on the level of break for a potentially more advantageous input and a better risk/yield ratio.
Risks : The sweater may never materialize and leave you out of the market if the explosion is fast.
5.4 Risk management and confirmations
Use complementary indicators : RSI , MacD, or volumetric to consolidate the management of expected.
Fundamental context : macroeconomic announcements or corporate publications can reverse a technical situation.
Money Management : essential, because even if the probability of success is good, a single trade losing poorly managed can ruin your earlier earnings.
Conclusion on the triangle descending in trading
The descending triangle is often considered as a figure oriented towards the pursuit of a lower movement, due to its appearance (declining summits, support subject to multiple tests). The data gathered by Thomas Bulkowski, however, reveals a more complex reality : around 53 % of breaks would actually be made from above , and only 47 % from below. In addition, the average increase after a bush breekout turns out to be significantly greater (+38 %) than the average decrease after a bearish breakout (-15 %).
These statistics do not mean that the downstream configuration is obsolete, but recall that the context must always be analyzed (dominant trend, volatility, volumes) and remain on the lookout for market manipulations . A cautious approach combining technical analysis, strict risk management and taking into account the fundamental environment is the best strategy.
Warning : trading has risks. Chartist figures, including the descending triangle, do not guarantee any results. It is essential to adopt an adapted risk management, to properly place your stop-loss and to remain aware of the impact of fundamental events (macroeconomics, announcements of results, political news, etc.) on price evolution.
Investments in cryptocurrencies are risky. Crypternon could not be held responsible, directly or indirectly, for any damage or loss caused following the use of a property or service put forward in this article. Readers must do their own research before undertaking any action and investing only within the limits of their financial capacities. Past performance does not guarantee future results. This article does not constitute an investment .
Certain links of this article are sponsorship links, which means that if you buy a product or you register via these links, we will collect a commission on the part of the sponsored company. These commissions do not train any additional cost for you as a user and certain sponsorships allow you to access promotions.
AMF recommendations. There is no guaranteed high yield, a product with high performance potential implies a high risk. This risk taking must be in line with your project, your investment horizon and your ability to lose part of this savings. Do not invest if you are not ready to lose all or part of your capital.
All our articles are subject to a rigorous verification of the facts. Each key information is verified manually from reliable and recognized sources. When we cite a source, the link is systematically integrated into the text and highlighted by a different color, in order to guarantee transparency and allow the reader to consult the original documents directly.
To go further, read our pages legal notices , privacy policy and general conditions of use .

Yoann
Training engineer, I quickly became interested in the field of finance. Convinced that decentralized finance has a bright future ahead of it, I participate in its democratization by developing Crypternon.